
 Cloud
Luna · DSH Standard Mode
11:45
Coding agent runtime benchmark
Four conditions. One task, one repo, one rubric.
Same task · 99–100/100 rubric score · net 11:45–54:48
Cloud11:45
Cloud13:48
 llama.cppLocal
19:57
llama.cppLocal54:48
Captured: 2026-08-22T09:15:00+02:00
OS
Windows 11 Pro
CPU
AMD Ryzen 9 7950X
Cores
16C/32T
RAM
128 GB
GPU / VRAM
NVIDIA GeForce RTX 4090 / 24 GB
GPU driver
610.88
| Run | Runtime | Model | Format / quantization | Context / KV cache | Backend |
|---|---|---|---|---|---|
| Qwen3.8-27B · MTP off (Local) | DeepSeek Harness (dsh) 0.1.0-rc.8 | Qwen3.8-27B-UD-Q4_K_XL.gguf (spec. decoding: none) | GGUF / UD-Q4_K_XL | 131072 tokens (128K) / Q8 (q8_0 K, q8_0 V) | llama.cpp llama-server 0.1.0-rc.8 |
| Qwen3.8-27B · MTP n=3 (Local) | DeepSeek Harness (dsh) 0.1.0-rc.8 | Qwen3.8-27B-UD-Q4_K_XL.gguf (spec. decoding: draft-mtp, n=3) | GGUF / UD-Q4_K_XL | 131072 tokens (128K) / Q8 (q8_0 K, q8_0 V) | llama.cpp llama-server 0.1.0-rc.8 |
| Luna · DSH Standard Mode (Cloud) | DeepSeek Harness (dsh), openai-codex provider, 0.1.0-rc.8 | gpt-5.6-luna (reasoning effort: max) | not exposed by provider | 272000 tokens / not exposed by provider | not exposed by provider |
| Luna · Codex Desktop (Cloud) | Codex Desktop 0.149.0-alpha.4.1 | gpt-5.6-luna (reasoning effort: max) | not exposed by provider | 258400 tokens / not exposed by provider | not exposed by provider |
Per-run values come from each session's own export (DSH session-header fields, or Codex Desktop's own token-usage/rollout export); host hardware was re-verified on the same machine on 2026-08-22.
The two cloud runs' own session headers report different context windows (272,000 vs. 258,400 tokens) for the identical model, most likely reflecting different provider/routing paths rather than a real model difference.
Four conditions · 99–100/100 rubric score
What the raw session number actually contains
Two of the three components below have nothing to do with the model doing the task.
Model, tools, and orchestration actually doing the work
Human reaction time to a sandbox-escalation prompt
The tool's own automatic summarization call once context fills, unprompted
Lower is better · minutes, corrected for approval wait and compaction
Composition of raw wall-clock time; net task time is what is left
Higher is better · output tokens per second, net of the correction
Each system's own accounting; not a shared unit across local and cloud (see limitations)
Number of discrete tool calls; neither direction is inherently better
Higher is better · out of 100, scored by a reviewer who read the diff and ran verification
| Condition | Correctness /45 | Tests /20 | Robustness /15 | Maintainability /10 | Scope /10 | Total |
|---|---|---|---|---|---|---|
| Luna · DSH Standard Mode | 45 | 20 | 15 | 10 | 10 | 100 |
| Luna · Codex Desktop | 44 | 20 | 15 | 10 | 10 | 99 |
| Qwen3.8-27B · MTP n=3 | 45 | 20 | 15 | 9 | 10 | 99 |
| Qwen3.8-27B · MTP off | 45 | 20 | 15 | 10 | 10 | 100 |
Four independent, isolated clones of the same Cloudflare Worker repository received the identical task at the identical commit: add a durable D1 ledger so a Telegram webhook update is never scheduled twice, even under concurrent duplicates or an ambiguous transient database error, plus a 14-day job that prunes only terminal rows. Four conditions ran it: a local Qwen3.8-27B with speculative decoding off, the same model with it on (draft-mtp, n=3), and a hosted GPT-5.6 "Luna" at reasoning effort "max" through two different agent tools, DSH standard mode and OpenAI's own Codex Desktop. An independent reviewer then scored every submission against the same 100-point rubric by reading the diff, running type-check and the test suite directly, and checking all 11 required test scenarios one by one.
All four landed at 99 or 100 out of 100. So on this task, code quality was not what separated the four conditions — net task time was. For every condition, approval-wait time and automatic context compaction were excluded from the measured time, since both are overhead, not model work; every duration below is already a net figure.
DSH standard mode raises a sandbox-escalation prompt (for example, to let Vitest's config loader spawn a child process) and waits for a human to click allow; the gap between that prompt and the click is pure reaction time, not agent work, and was excluded from the measurement. Separately, once the context window fills, DSH runs an automatic summarization call on its own initiative, no human involved, but it still burns real minutes — that time is excluded too.
One single approval click alone accounted for 11:53 excluded from the DSH+Luna run. DSH standard mode + Luna's net task time is 11:45 — ahead of Codex Desktop's 13:48, which raised no comparable approval prompt. The same accounting applies to the two local Qwen runs: MTP off had 5:54 excluded across two automatic compactions, MTP n=3 had only 1:42 excluded across one.
The identical local model's net task time dropped from 54:48 with speculative decoding off to 19:57 with it on — 2.7 times faster, with output throughput moving from 33.8 to 55.5 tokens per second. Tool-call counts moved the other direction: MTP off took 93 calls to reach the same result, MTP n=3 took 61. Neither number was estimated; both come from the DSH session's own tool-call events.
No. Every submission passed type-check and its full test suite, covered all 11 required test scenarios with behavioral assertions rather than string-matching against SQL, and correctly implemented the hardest part of the spec: an atomic SQL claim (`INSERT ... ON CONFLICT`) with the same claim token reused across retries, so a lost-response-then-retry readback is recognized as the caller's own successful claim instead of a duplicate. Nobody touched a forbidden file, added a dependency, or showed any sign of delegation. The two 1-point deductions were both placement nitpicks: retention pruning wired to fire on every accepted webhook instead of the existing cron trigger, and one finalization function that grew slightly past the task's "keep the route small" instruction, not behavioral bugs.
One reviewer, working on the Luna/Codex Desktop submission, caught something the rubric does not score. That submission's claim token is generated fresh per Worker invocation instead of being derived deterministically from the update ID. If every attempt inside a single delivery's retry loop reports a transient error to the caller, but one of those attempts actually committed silently, the row is left in a "processing" state under a token no future request knows about. A Telegram redelivery is a new HTTP request with a newly generated token; it reads the existing row's now-different token, treats it as someone else's claim, and the update can end up stuck permanently. Since retention only prunes terminal rows, it never gets cleaned up either. This was not independently re-checked against the other three implementations' exact token-generation code, so treat it as a question worth a closer look across all four, not a confirmed defect in one.
This is a single repetition per condition, a pilot. The benchmark's own manifest recommends at least three repetitions per condition with a freshly randomized order before treating any ranking as definitive. Local and cloud token accounting are not the same unit: DSH sums new-input, output, and cache-read as three separate additive counters, while Codex Desktop reports one cumulative input counter in which cached input is already a subset, so do not compute a ratio across that boundary. Output tokens per second is a time-to-useful-output measure, not an isolated decode-speed benchmark: it includes tool-execution time for every run and network and API queueing for the two cloud runs. The two cloud runs' own session headers report different context windows for the identical model, which was not independently resolved and may reflect different provider routing rather than a real model difference. The stuck-processing-row risk above was identified in one submission and not independently checked against the other three's exact token-generation code.
The clean result here is the speculative-decoding comparison: same model, same hardware, one flag changed, a 2.7x difference with no quality cost in this run. The messier result is the agent-tool comparison: DSH standard mode and Codex Desktop produced a materially different amount of non-task overhead on the same model doing the same job, and that overhead was invisible until the session logs were read event by event. Before trusting either number as a property of the tool rather than of this one run, it needs three repetitions per condition with a randomized order, and ideally a version of the approval flow that does not put a human's reaction time in the middle of a routine sandbox escalation.
The measurements were reconstructed from four retained session exports: three DSH `session.jsonl` files and the Codex Desktop CLI's token-usage and rollout export.
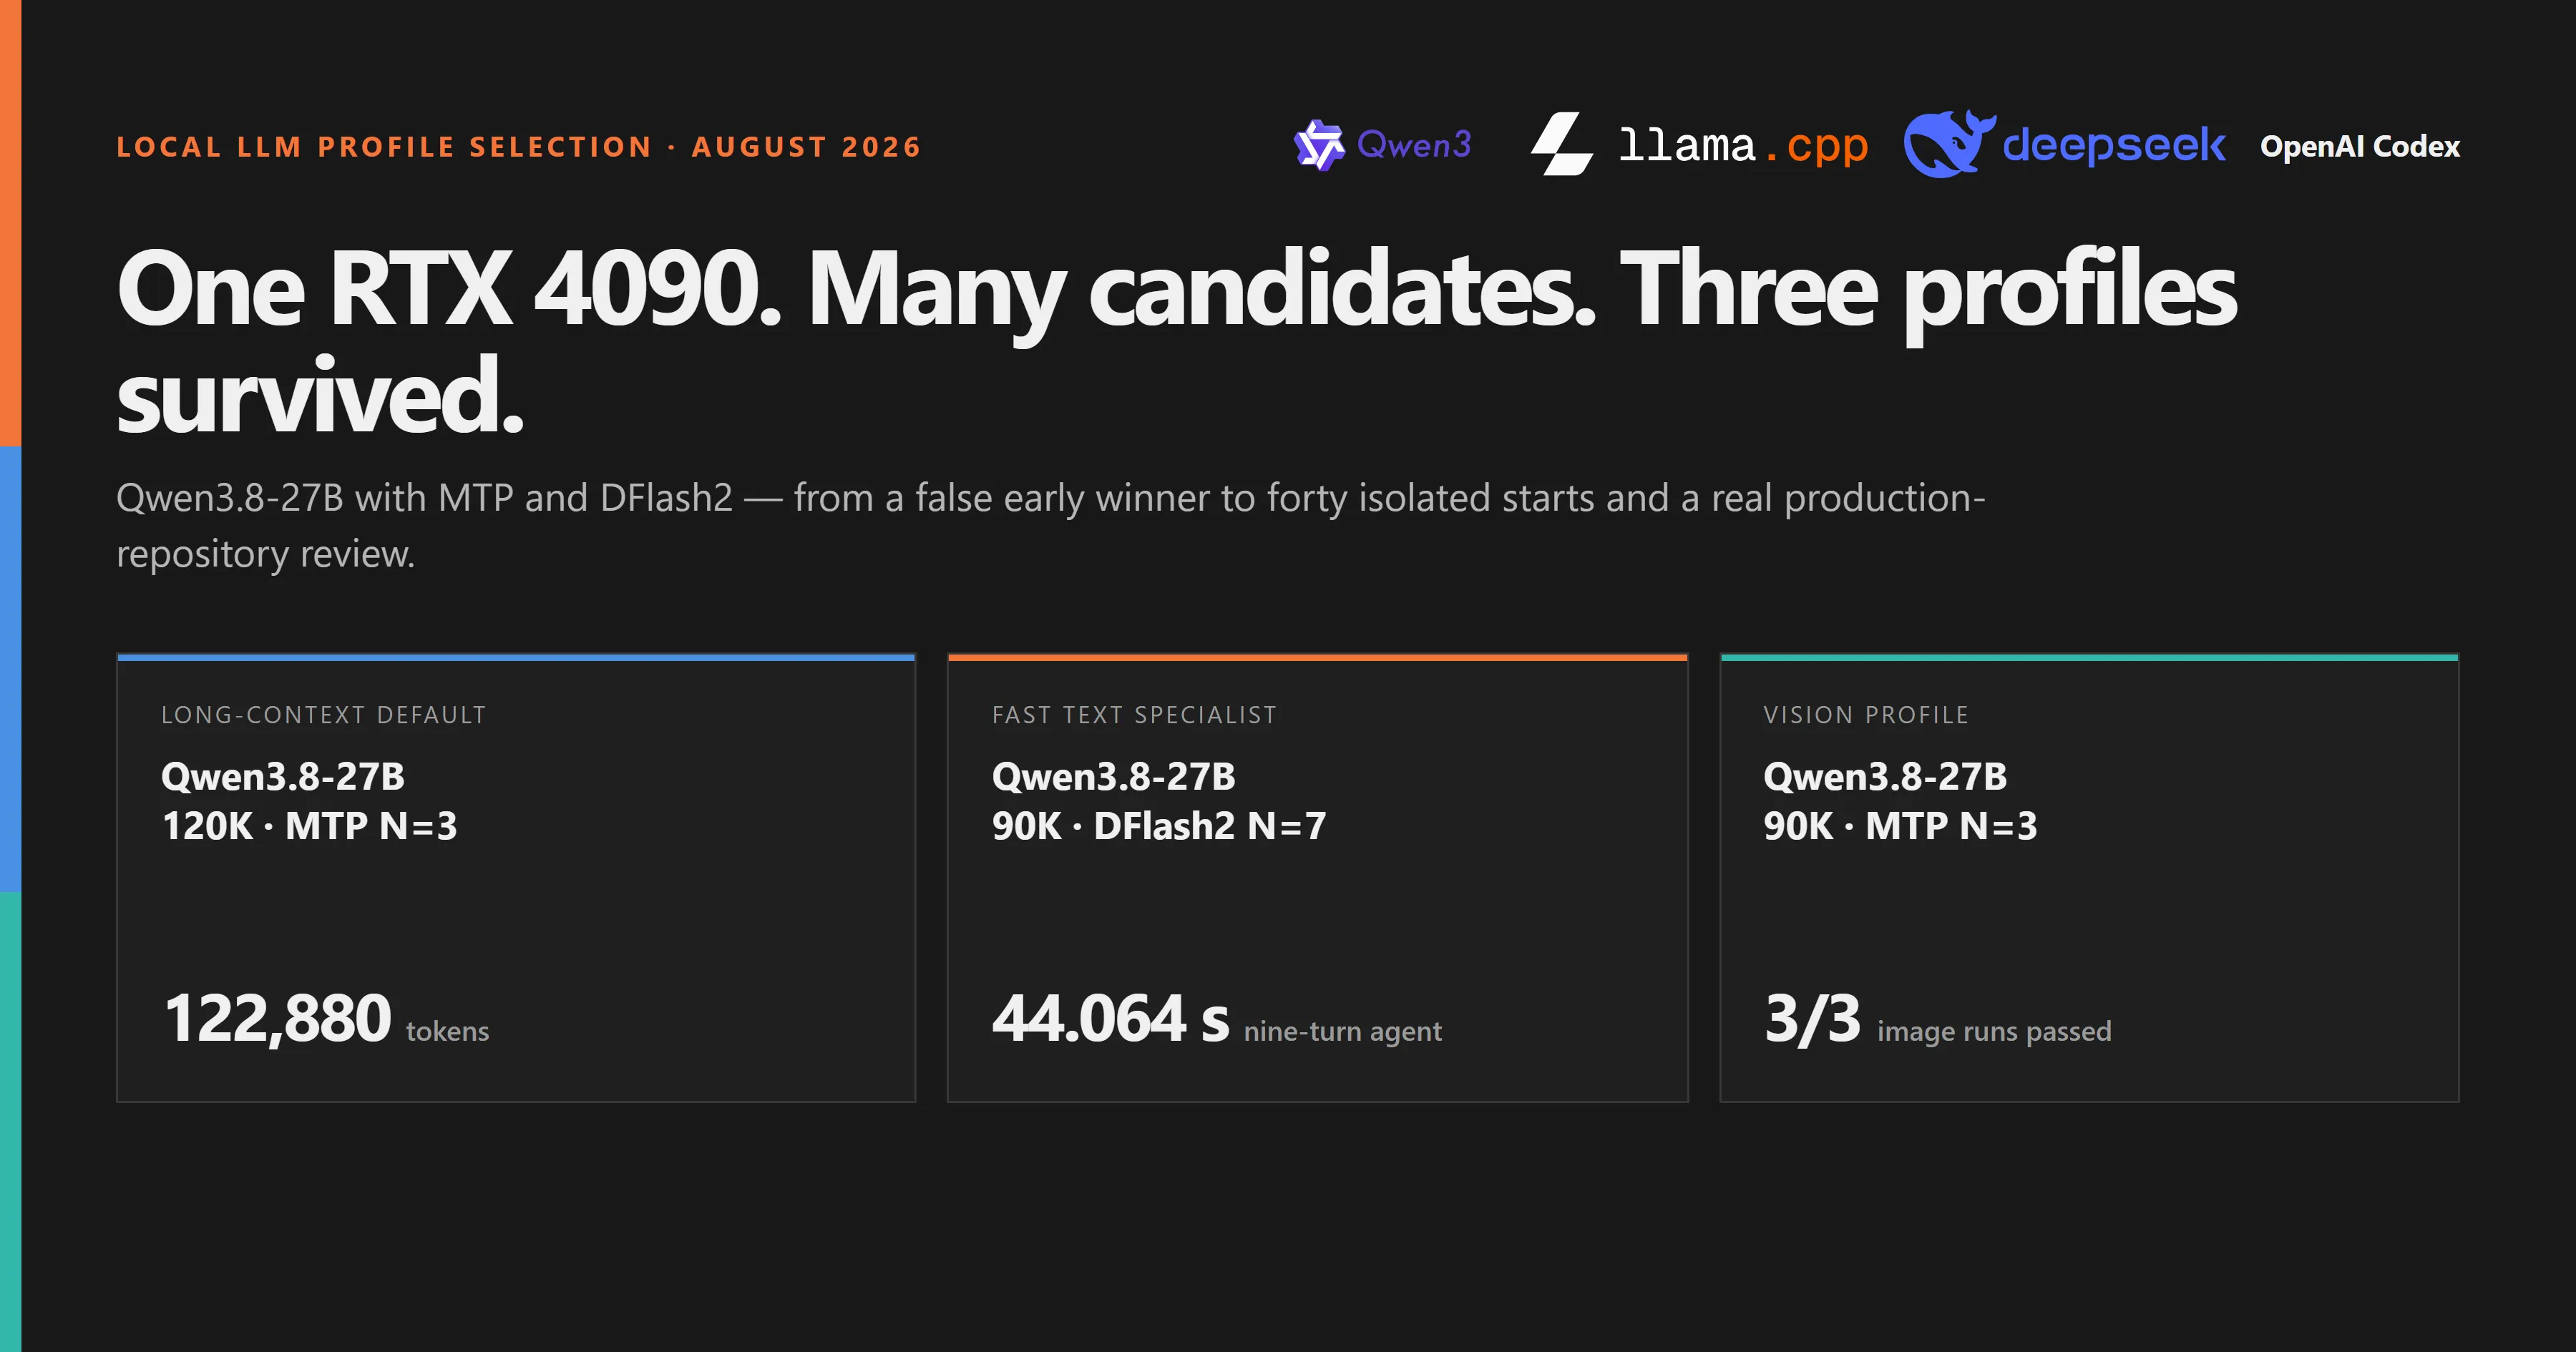
From many candidates to three profiles: Qwen3.8-27B with MTP and DFlash2
On one RTX 4090, MTP and DFlash2 profiles were eliminated stage by stage. The result is not one universal winner, but a 120K MTP default, a fast 90K DFlash2 text specialist, and a verified 90K MTP vision profile.
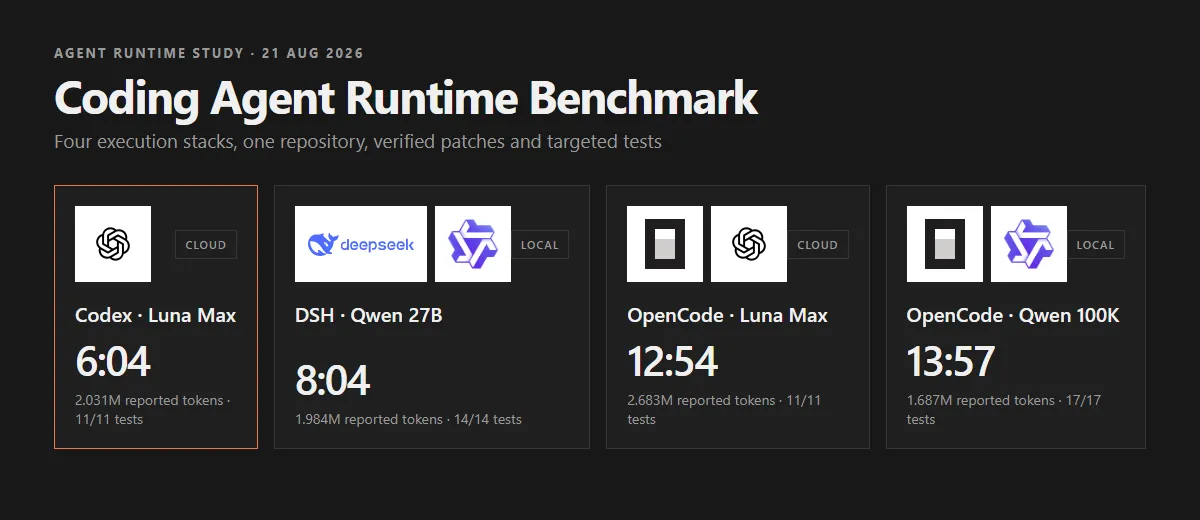
Coding agent benchmark: how much the runtime layer changes the result
Four coding-agent runs changed the same repository and passed their targeted tests. Wall time still ranged from 6:04 to 13:57 because model, harness, cache and review acted together.
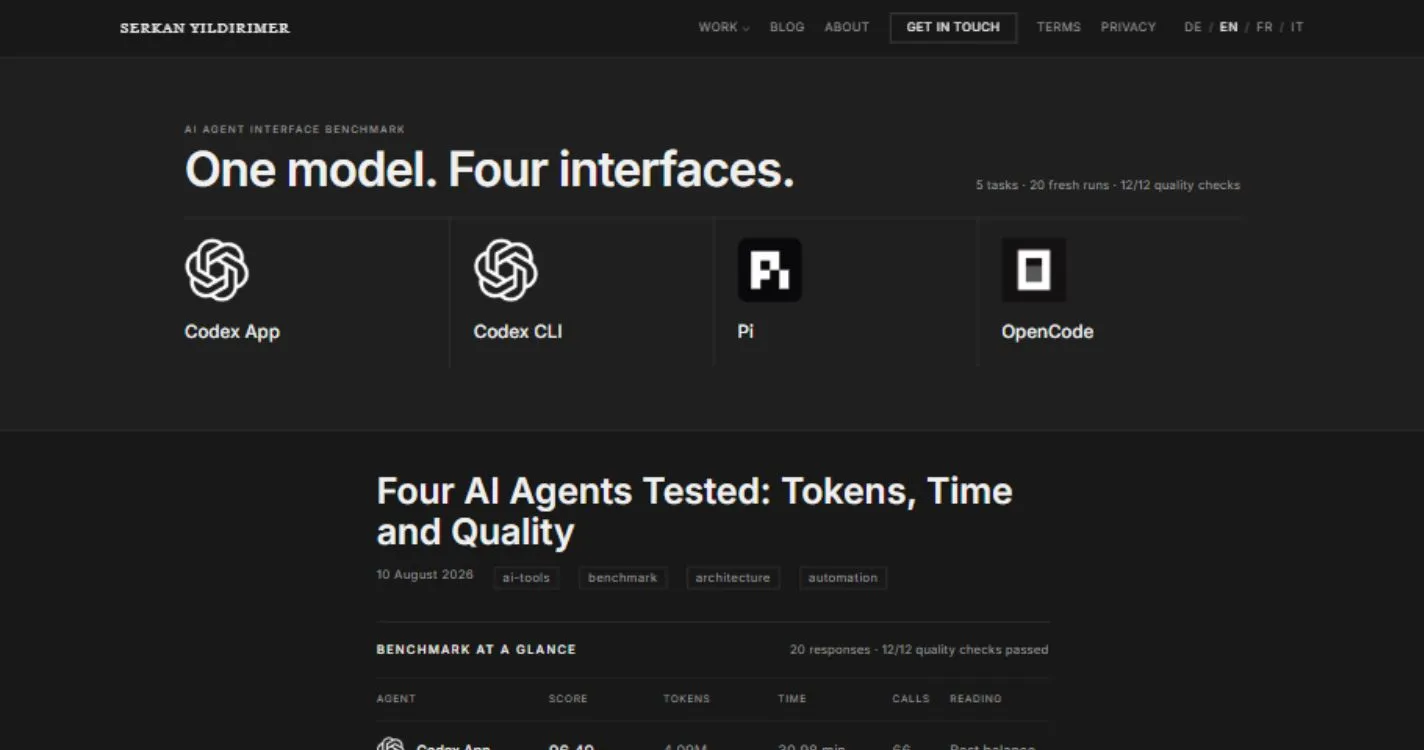
Four AI Agents Tested: Tokens, Time and Quality
The same AI model, four agent interfaces and five real repository tasks: what actually changed in quality, token volume, runtime and working style.